Table of Contents
- Theory and Concepts
- Adding Accord Data to Your Existing Reports
- Creating your own Dashboard
- Real World Example 1
Prerequisites & Permissions
- Your Accord instance must be connected to Salesforce. Refer to this helpful guide for integration setup instructions.
- You must have the appropriate Salesforce permissions to create the desired Reports and Dashboards.
Theory and Concepts
We recommend using Salesforce’s native reporting functionality. It allows you to easily measure sales execution.
Since almost any action in Accord can be pushed to Salesforce, this means you can easily combine your CRM data with Accord data.
Whenever and Accord is connected to a Salesforce object (like an Opportunity) will be pushed in real-time from Accord to that object. See Sync Accord Data to Salesforce Fields and Execution Criteria to learn more about what data can be synched to Salesforce.
Adding Accord Data to Your Existing Reports
You can easily add Accord data to enhance your existing Opportunity reports. Say for example you want to understand how many customers have been invited to an Accord or accepted their invitation, or you want to understand if a specific step has been completed – like aligning on a "go live" date – you can add this data to an Opportunity report. Each piece of Accord data would be added as an additional column.
Create Your Own Accord Dashboards
Build dedicated Accord Dashboards in Salesforce to track sales process adoption and operational excellence. Use the native dashboard creation process found in Salesforce, but focus your visualizations on key Accord metrics to gain deeper insight into team performance and execution adherence.
Common metrics to include on an Accord Dashboard:
- How many in-quarter Opportunities should have Accords? This will be your denominator for most of the dashboard.
- What is the delta between Opportunities with and without Accords?
- How many Accords have customers invited or accepted?
- Special company-specific requirements (this varies from team to team)
- Has a go-live date been set?
- Has an executive sponsor been engaged?
- Has a stakeholder map been completed?
- Has a POC been completed or kicked off?
We recommend adding filters so that Sales leadership can easily filter by:
- Opportunity owner manager or director
- Opportunity Value
- Close date
- Sales Stage
Real World Example 1
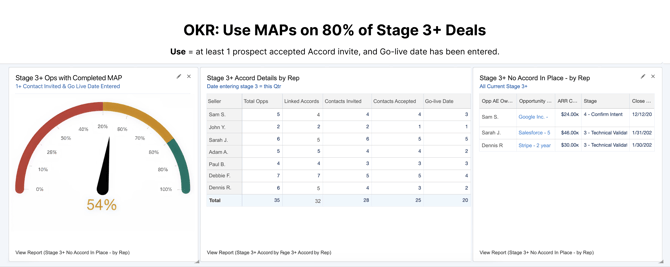
Imagine your sales organization has an OKR to use Mutual Action Plans (MAPs) on 80% of Q4 opportunities, where “use” is defined as having at least one customer accepted to the Accord and a “go-live” date captured.
To report on this, we recommend breaking out each of the requirements that would need to be met to satisfy having a MAP "used". This includes: (1) having an Accord linked to the opportunity, (2) having a prospect invited, (3) having a prospect accepted, and (4) having Go-live date captured.
In the image below, you can see an example of how this might look in Salesforce:
- Widget 1: Percentage of in-quarter opportunities that have satisfied all MAP requirements.
- Widget 2: Opportunity breakdown by AE, showing total count and progress against each requirement. The first column is the total number of Opportunities per AE, followed by: (1) total qualifying Opportunities, (2) qualifying Opportunities linked to an Accord, (3) Opportunities with at least one customer invited, (4) Opportunities with at least one customer accepted, and (5) Opportunities with a Go-live date captured.
- Widget 3: List of in-quarter Opportunities that do not yet have an Accord associated.
If you have multiple front-line managers, you can roll these totals up by reporting hierarchy. This makes it easy to see how consistently the AEs reporting to each manager are following the process, and you can continue aggregating the view up through area Directors and VPs.